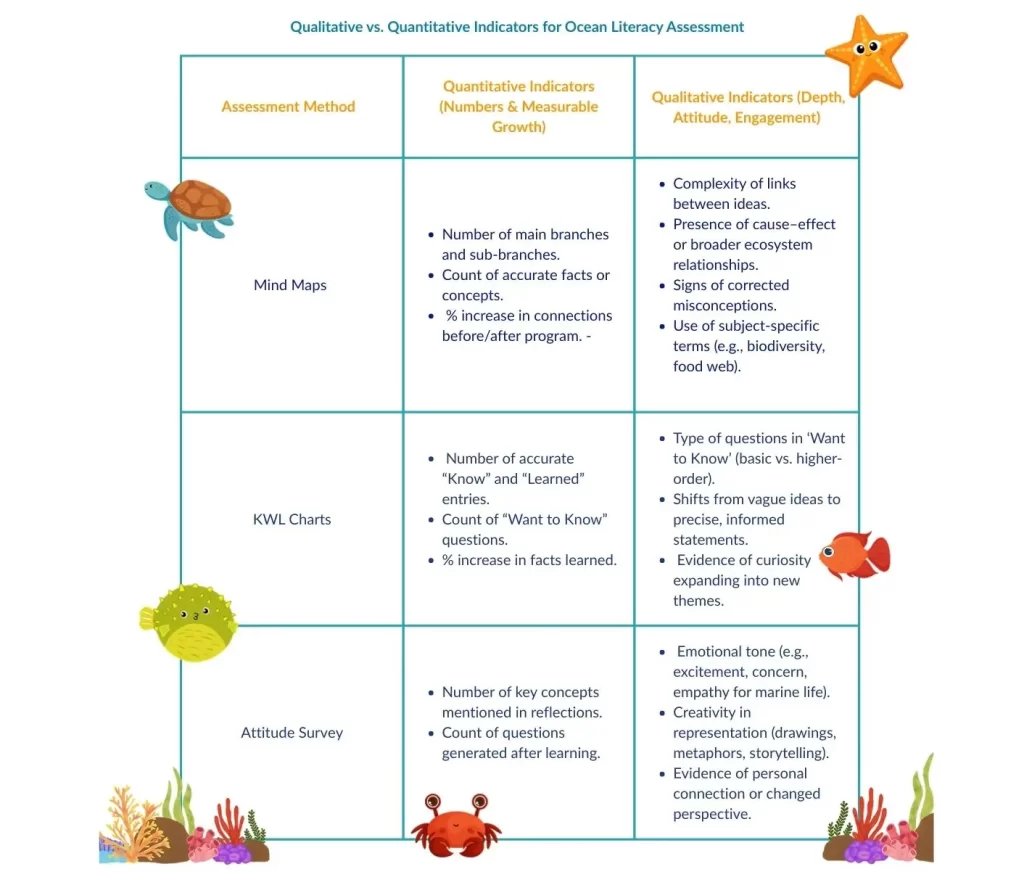
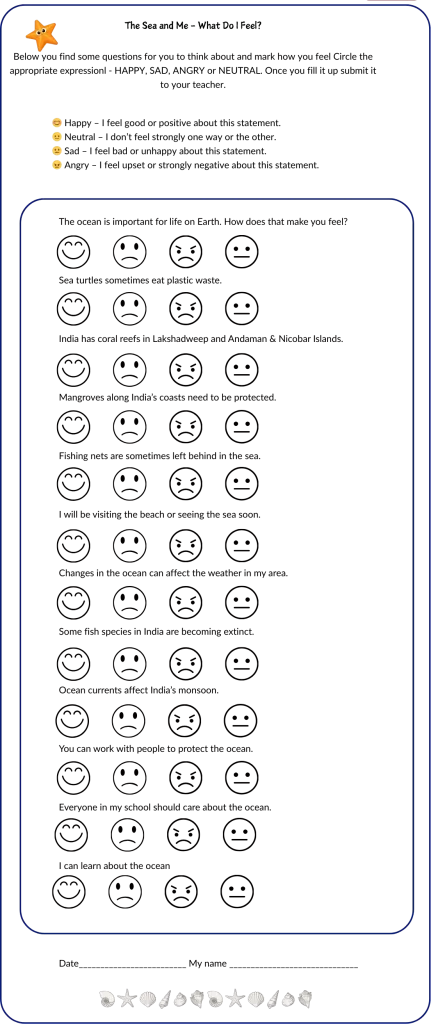
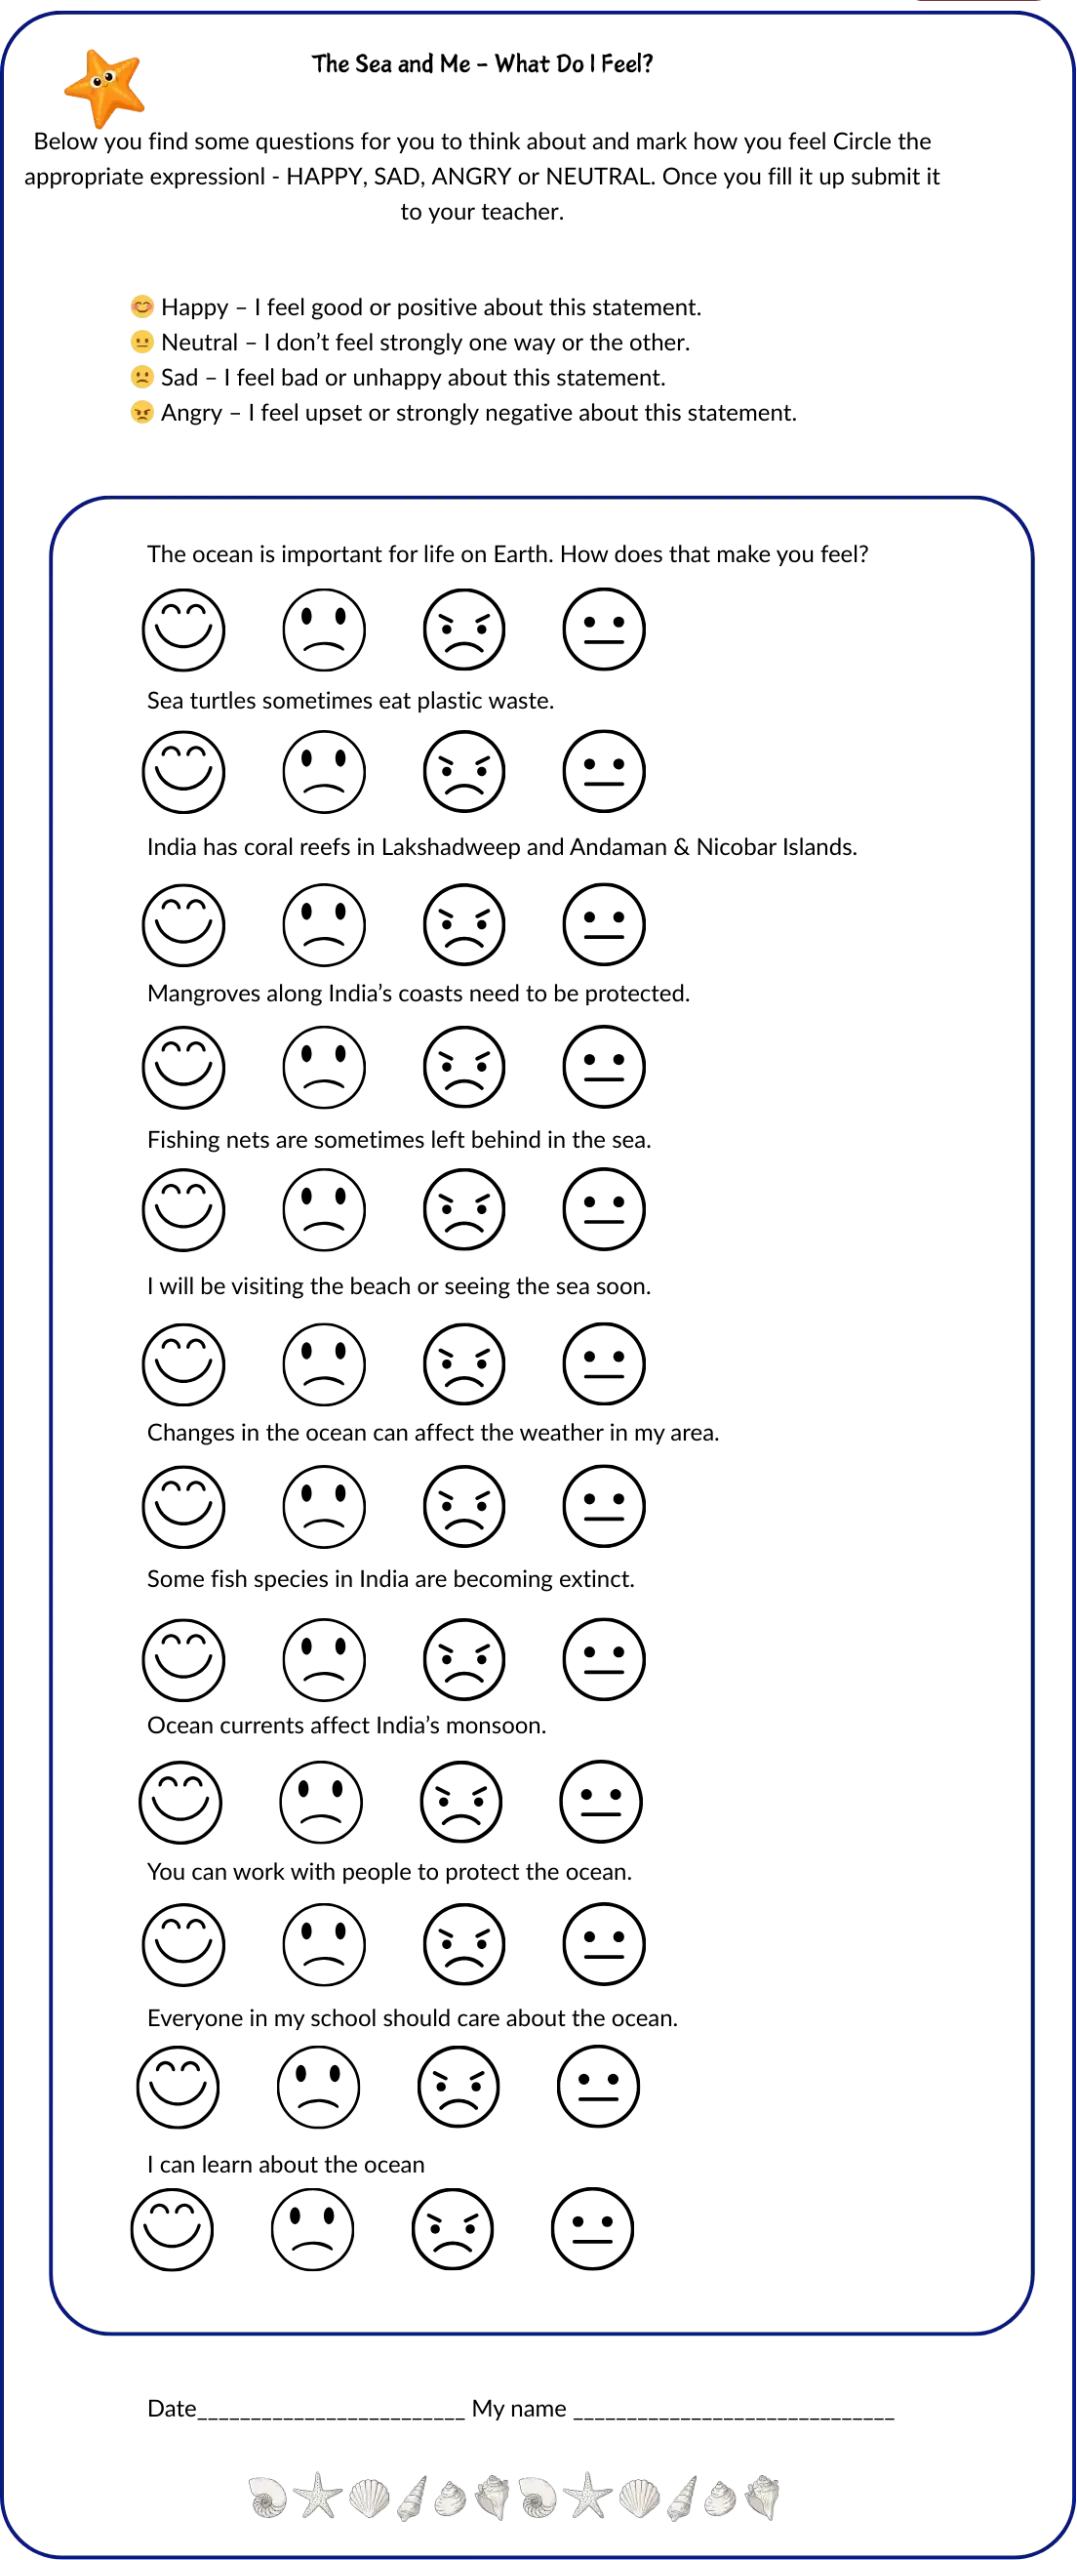
Assessment Tools &Techniques

Assessment

Assessment in ocean literacy is not just about testing knowledge—it’s about capturing how students think, connect ideas, and express what they’ve learned about the ocean. For students, interactive and reflective assessment tools help teachers track both knowledge growth and attitude shifts.

Three methods work especially well:

  • Mind Maps – to visualize and measure conceptual connections.
  • KWL Charts – to track learning progress and identify gaps.
  • Attitude Survey – to explore personal reflections, creativity, and curiosity.
Assessment
Assessment


Each method offers both quantitative measures (e.g., number of connections, questions, or accurate facts) and qualitative insights (e.g., depth of thought, creativity, emotional engagement). Together, they give a fuller picture of how students are developing ocean literacy skills.


Quantitative assessment tells us how much knowledge has changed. Qualitative assessment, on the other hand, looks at how students think, feel, and apply what they’ve learned.

Depth of understanding – Are students making more meaningful connections between concepts?


Attitude shifts – Are they showing more care, responsibility, or empathy towards marine life?


Curiosity and inquiry – Are their questions becoming more thoughtful and investigative?


Creative expression – Are they using new ways to describe, illustrate, or explain ocean-related ideas?


Misconceptions – What misunderstandings still exist, and how are they evolving?

Sounds of the Ocean
Sounds of the Ocean

In practice, qualitative assessment involves observing and interpreting. For example, the complexity of ideas in a mind map, not just the number of branches or the types of questions students add in the KWL chart—from basic factual to open-ended ‘why/how’ inquiries. Also the tone, detail, and emotional engagement in expressions—drawings, stories, or verbal reflections.


While qualitative data is less about numbers, it’s rich in meaning. Teachers can use short notes, checklists, or rubrics to record these observations, making them easier to track over time.

assessment

It is important to choose the assessment technique you need correctly. Remember these are not tests, but an important tool to assess ocean literacy towards action for sustainability and climate mitigation. This is more a test of how we as educators have achieved our goal, rather than a test of whether the student is passing a grade or not.

MIND MAPS

Mind maps with students can be colourful and messy.
They should be done before and after the education program to assess students or target audience.

coastline paradox

Best for measuring conceptual growth and connections


Use when

  • You want to compare before and after learning to see changes in understanding.
  • You need to measure how ideas are linked (e.g., how students connect ‘ocean currents’ to ‘climate’ and ‘marine life’).
  • You’re introducing a complex topic with many interrelated parts, like coral reef ecosystems or food webs.

Strengths

  • Quantifies growth in knowledge (more connections, more accurate facts).
  • Reveals misconceptions visually.
  • Encourages students to think in systems.
dance-beneath-your-feet

Background

Mind maps were popularised in the 1970s by British psychologist Tony Buzan, who developed them as a visual thinking tool to help organise ideas, improve memory, and stimulate creativity. The concept builds on earlier practices of diagramming and radial note-taking used in education and psychology.


Usually mind maps are used to help organise thoughts and plan work flows. Here we are using mind maps as assessment tools while having a little fun. The idea is to have a central theme and then write as many thoughts you have about that theme. This will give you an idea of what you know, perceive or believe about a topic.

Take for example the topic of ‘School’. As illustrated we have written the word in the centre and circled it. Then, proceed to write what you think or know about school. Try and make subheadings or broader categories in the next circle and then go further into detail. These are the relationships between the central theme. Then draw lines to connect the linkages between the categories. The more linkages the more complex your map becomes. Do not worry about it being neat. The more you can put down on paper, the better it will showcase what is on your mind.


For example, school could have class or grades. Under grade, you could have sections or age group. Another category could be teachers, linked with the subjects they teach, which can be linked to students who are linked to their parents and so on.

Activity
Instructions

Once the students have understood how to make a mind map, give them a plain sheet of paper.


You can begin with just the word ‘OCEAN’ to get an overall idea of what your students think of the ocean. The illustration shows a real example from a school in Rameshwaram. You can clearly see the growth in concept and knowledge over time.

As you proceed through the principles, you can conduct the mind map before and after each chapter. For example, in principle 1, chapter Dance Beneath Your Feet, what you could be assessing is their knowledge of plate tectonics. In the circle, ask them to write ‘Plate Tectonics’.


Give them 10 minutes to write as many things as they can associate or think they know about it.


Remind them to make as many links as possible. Also, remind them that this is what is on their mind. There is no right or wrong; it is just so that you, as an educator, can teach them better.


Once they are done, have them write their names and the date and, collect the papers and keep them safely in a file. When you redo this activity at the end of the program distribute the early mind map to the students for them to compare and assess how their thoughts and knowledge base has changed over the program.

Post-Activity
Instructions

Mind Maps


Scoring Guide (Before & After)


Connections: 1 point for each branch/sub-branch.


Content Accuracy: 1 point per correct idea, 0.5 for partially correct, 0 for incorrect.


Growth Score: (After total – Before total) ÷ Before total × 100 = % improvement.

Instructions for Teachers

  1. Enter the student’s score from their initial mind map in the Before Score column.
  2. Enter the score from their post-program mind map in the After Score column.
  3. Calculate Points Gained as: After Score – Before Score.
  4. Calculate Growth % as: (Points Gained ÷ Before Score) × 100.
  5. Use Notes to record any observations about the student’s connections, depth, or creativity.
Assessment technique
assessment technique
Assessment technique

Lakshmi’s score went from 16 before the program to 54 after.


That means she learned a lot more than she already knew — in fact, her knowledge grew by ~3 times what she started with. A growth of 237.5% means she didn’t just add a little; she almost tripled the information in her mind map compared to her starting point.

Template

Reflection


As a whole class or in small groups, discuss with your students

  • One thing they learned that surprised them.
  • One question they still have about the topic.
  • One connection they can make between what they learned and the real world

K.W.L MAP

Pre-Activity
Instructions

The KWL method is a simple yet powerful way to assess students’ knowledge and curiosity about the ocean. By starting with What I Know, teachers can gauge students’ prior understanding and correct misconceptions early. The What I Want to Know section captures students’ interests, helping tailor lessons to their curiosity and ensuring engagement. Finally, What I Learned measures the knowledge gained, providing clear evidence of learning progress. This approach not only tracks changes in understanding but also reveals shifts in interest and awareness, making it especially useful for measuring the impact of ocean literacy programs.

Best for tracking curiosity and knowledge gaps


Use when:


You want to activate prior knowledge at the start of a unit.
You need to guide your teaching by seeing what students want to know.
You’re introducing a new theme (e.g., “Marine pollution” or “Sharks and rays”).


Strengths:


Shows exactly what students already know and what they want to explore.
Highlights interest areas so lessons can be tailored.
Provides a clear “before vs. after” snapshot of fact-based learning.

dance-beneath-your-feet

Activity
Instructions

K.W.L Sticky Note Activity!

Sticky
Sticky

Keep a stack of three different colours of paper or sticky notes at your table. Tell the students that they are going to fill in information on ‘what they know’ (K) and ‘what they want to know’ (W) on a topic that you will give them. For example, before you plan on teaching ‘Principle 1-Dance beneath my feet’ you can put the topic of ‘PLATE TECTONICS and OCEANS’ on the board.


Explain the colour codes of the sticky notes.
Yellow = K – students write facts or ideas they already know about the topic.
Pink = W – they write questions or things they want to know.
Orange = L – what they have learned (to be done after the sessions on the topic)


Then instruct them to come up to your table, take the appropriate coloured note, write what they know or want to know and stick it in the correct column.
On yellow,
On pink,

After they write their thoughts have the students stick the notes on the under the K or W headings.


Then proceed with the lesson plan on the topic.
After the lesson or activity, give them orange notes.


Students write what they have learned and stick them under the L column.

Sticky
Sticky

Instructions for the online version of the KWL map

  • Write the chapter or topic at the top before beginning your assessment.
  • You can ask your students to call or ask them to come up to the screen and type what they know or what they would like to know directly in the space provided.
  • For pre-assessment, select the yellow colour for ‘what they already know’ (yellow sticky notes) and check the pink for ‘what they want to know’ (pink sticky notes).
  • You can add up to 32 sticky notes per screen to save as a png. If you need more than after you download the sheet you can clear the board ad start a new one and then save that as a 2nd file and so on.
  • Once all students have added their responses, download the sheet to save the Pre-Assessment.
  • Once you have taught the chapter/topic as planned, select the post assessment box and invite the students to write in ‘what they have learned’ in the Post-Assessment section (blue and orange sticky notes)
  • Once completed, download the sheet to save the Post-Assessment.
  • You can now compare the Pre-Assessment and Post-Assessment sheets.

Post-Activity
Instructions

Group Reflection:


As a whole class or in small groups, discuss with your students

  • One thing they learned that surprised them.
  • One question they still have about the topic.
  • One connection they can make between what they learned and the real world

ATTITUDE SURVEY

Pre-Activity
Instructions

An attitude assessment is a simple way to understand how students feel about a topic. It’s especially useful with groups who have different reading or writing abilities. This activity is done twice — once at the start of the program and again at the end — to see how opinions or feelings have changed over time.


Students will respond to a set of statements by choosing one of three facial expressions: happy, sad, or neutral. Each face shows how they feel about the statement. By comparing responses before and after the program, you can easily track shifts in perception and emotional connection to the topic.

Best for exploring attitudes, creativity, and emotional connection


Use when
You want to capture personal reflection and emotional engagement.
You’re ending a lesson or field activity and want students to share takeaways.
You want to promote creative communication (poems, drawings, videos, role-play).


Strengths
Reveals values and empathy towards ocean life.
Encourages higher-order thinking through open-ended questions.
Allows different forms of expression for varied learning styles.

dance-beneath-your-feet

Activity
Instructions

You can conduct this activity in one of two ways:

1. Answer Sheet Method:

The three facial expressions mentioned below represent the emotions they feel about those questions you frame based on the topic you teach. As you read each statement aloud, participants will circle the face that best represents their feelings:

  • If a question makes them feel good, they circle the happy face.
  • If it stirs a negative feeling, they choose the sad face.
  • For questions that leave them indifferent, they choose the neutral face.

2. Interactive Movement Method:
In an area where you have some space, you can paste or hang the different emotions of HAPPY, SAD, and NEUTRAL. As you read each statement aloud, ask participants to run to the space that matches their emotional response. You or an assistant can then note down their answers for each question. Both methods allow for flexibility and engagement, enabling you to gather insights into the participants’ perceptions effectively.
Comparing responses from before and after the program will help you measure changes in attitudes and assess the impact of your teaching.

emoji

Here is the first introductory survey you can conduct with your students before and after the whole 1OCEAN program

Post-Activity
Instructions

Once yours students have filled up the questionnaire, remind them to put their names and dates on the sheet. Collect it and keep it safe. After you have done some chapters on oceans, print another copy of the ‘Sea and Me – What do I feel?’ sheet and ask them to fill it up again. Then compare the change (if any) in their attitude and discuss why and what changed. Was it for the better?


You can conduct the attitude survey before and after each chapter or after a set of topics taught to get a more holistic view of how perceptions are changing. It will also help you modify your teaching techinques to have the best impact.

Scroll to Top